Affordability Watch Q1 2022
Executive Summary
U.S. households experienced a variety of challenges that affected affordability including housing shortages, delayed construction and housing cost increases that outpaced income growth. The demand for rental housing has been on a soaring trajectory due to job growth, household formations, income growth and limited affordable for-sale homes. As a result of the historically high demand and occupancy levels, rent growth reached extraordinary figures across the U.S.
Like rent growth, income growth has also seen major improvements. Labor force participation rates are still significantly below pre-pandemic levels while job openings are near record highs. Since labor supply is limited, employers are increasing wages to entice talent, which has resulted in some of the sharpest wage increases in years.
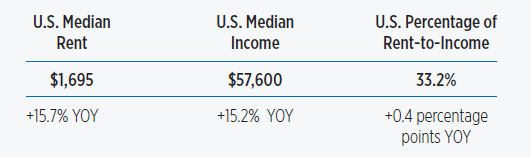
Even though income gains have advanced apartment demand, renters felt the pinch as rents and inflation rates continued upward. During Q1 2022, U.S. renter households in professionally managed properties spent on average 33.2% of their income on rent. Understandably, there was a broad variation in the share of income renters spent on rent at the market level.
In this analysis, the National Apartment Association (NAA) explores the distribution of rent-to-income percentages across U.S. markets, focusing specifically on areas with highest or lowest percentages.
Key findings:
- Renters in the U.S. spent on average 33.2% of their income on rent during Q1 2022, remaining relatively flat since Q1 2021.
- Rent growth marginally outpaced income growth across the nation by 0.5 percentage points.
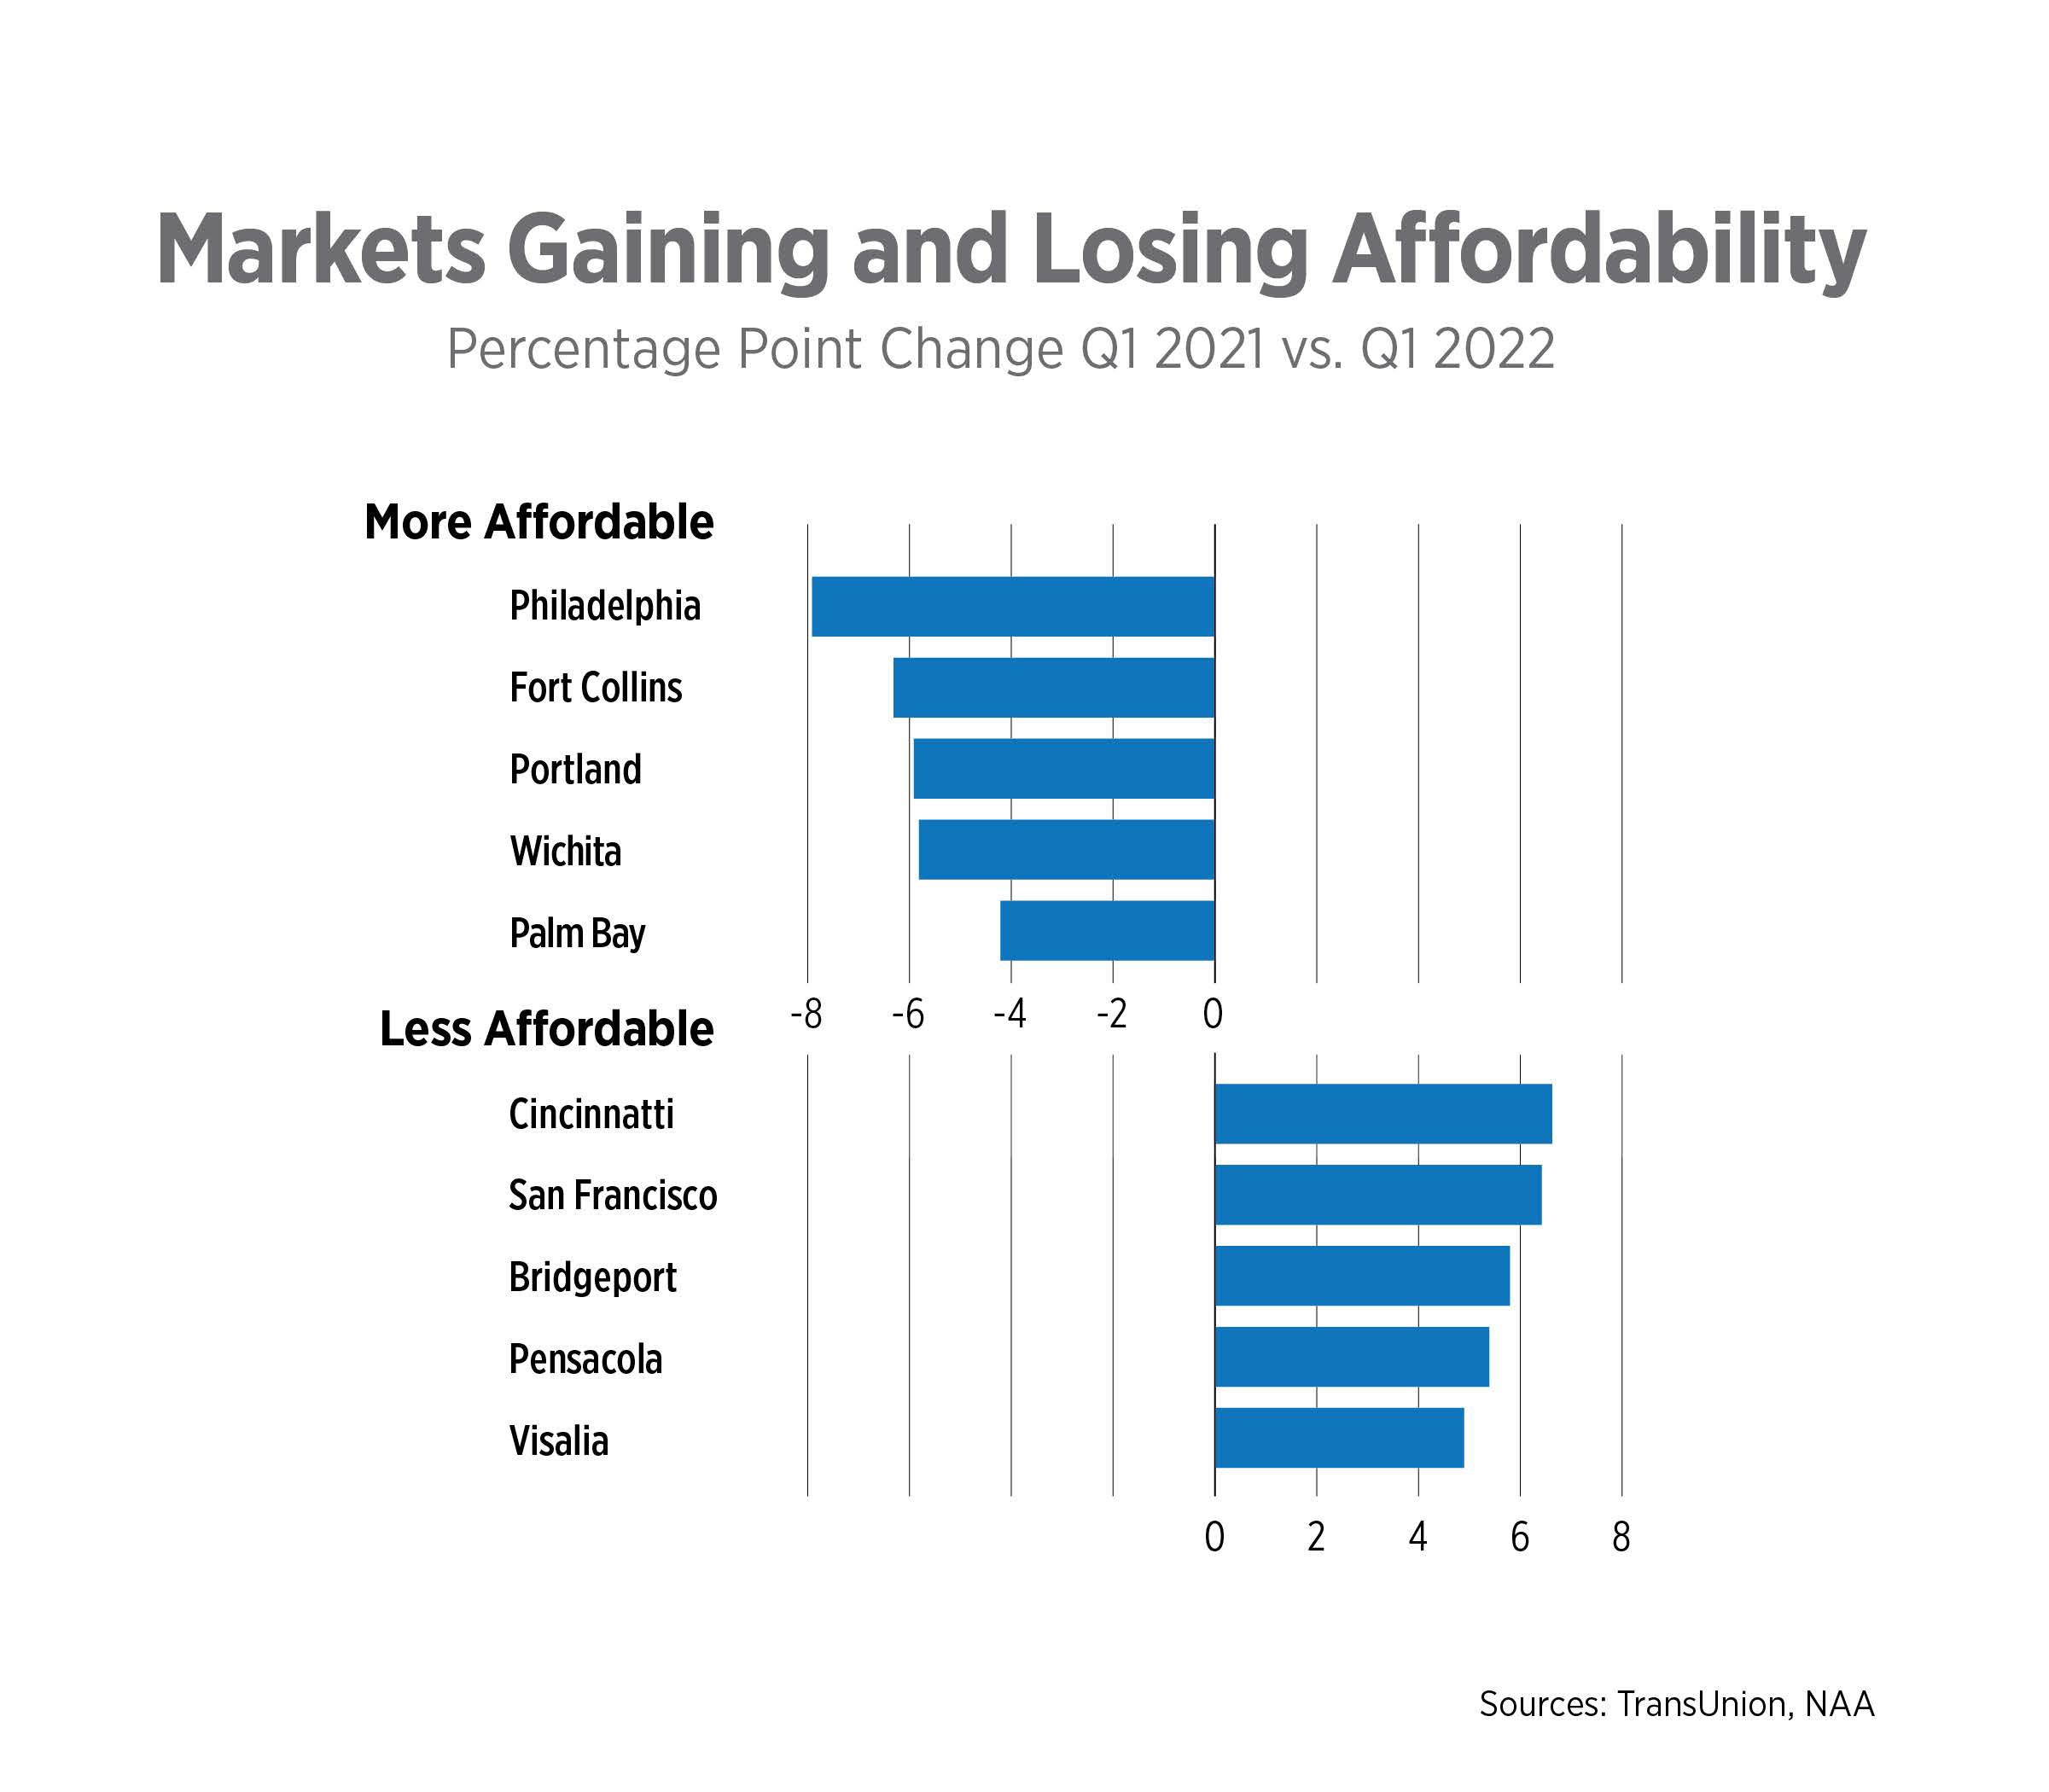
- Markets that posted the greatest improvement in rental affordability year-over-year included Philadelphia; Fort Collins, Colo.; Portland, Ore.; Wichita, Kan.; and Palm Bay, Fla. Meanwhile, affordability worsened in Cincinnati, San Francisco, Bridgeport, Conn., Pensacola, Fla., and Visalia, Calif.
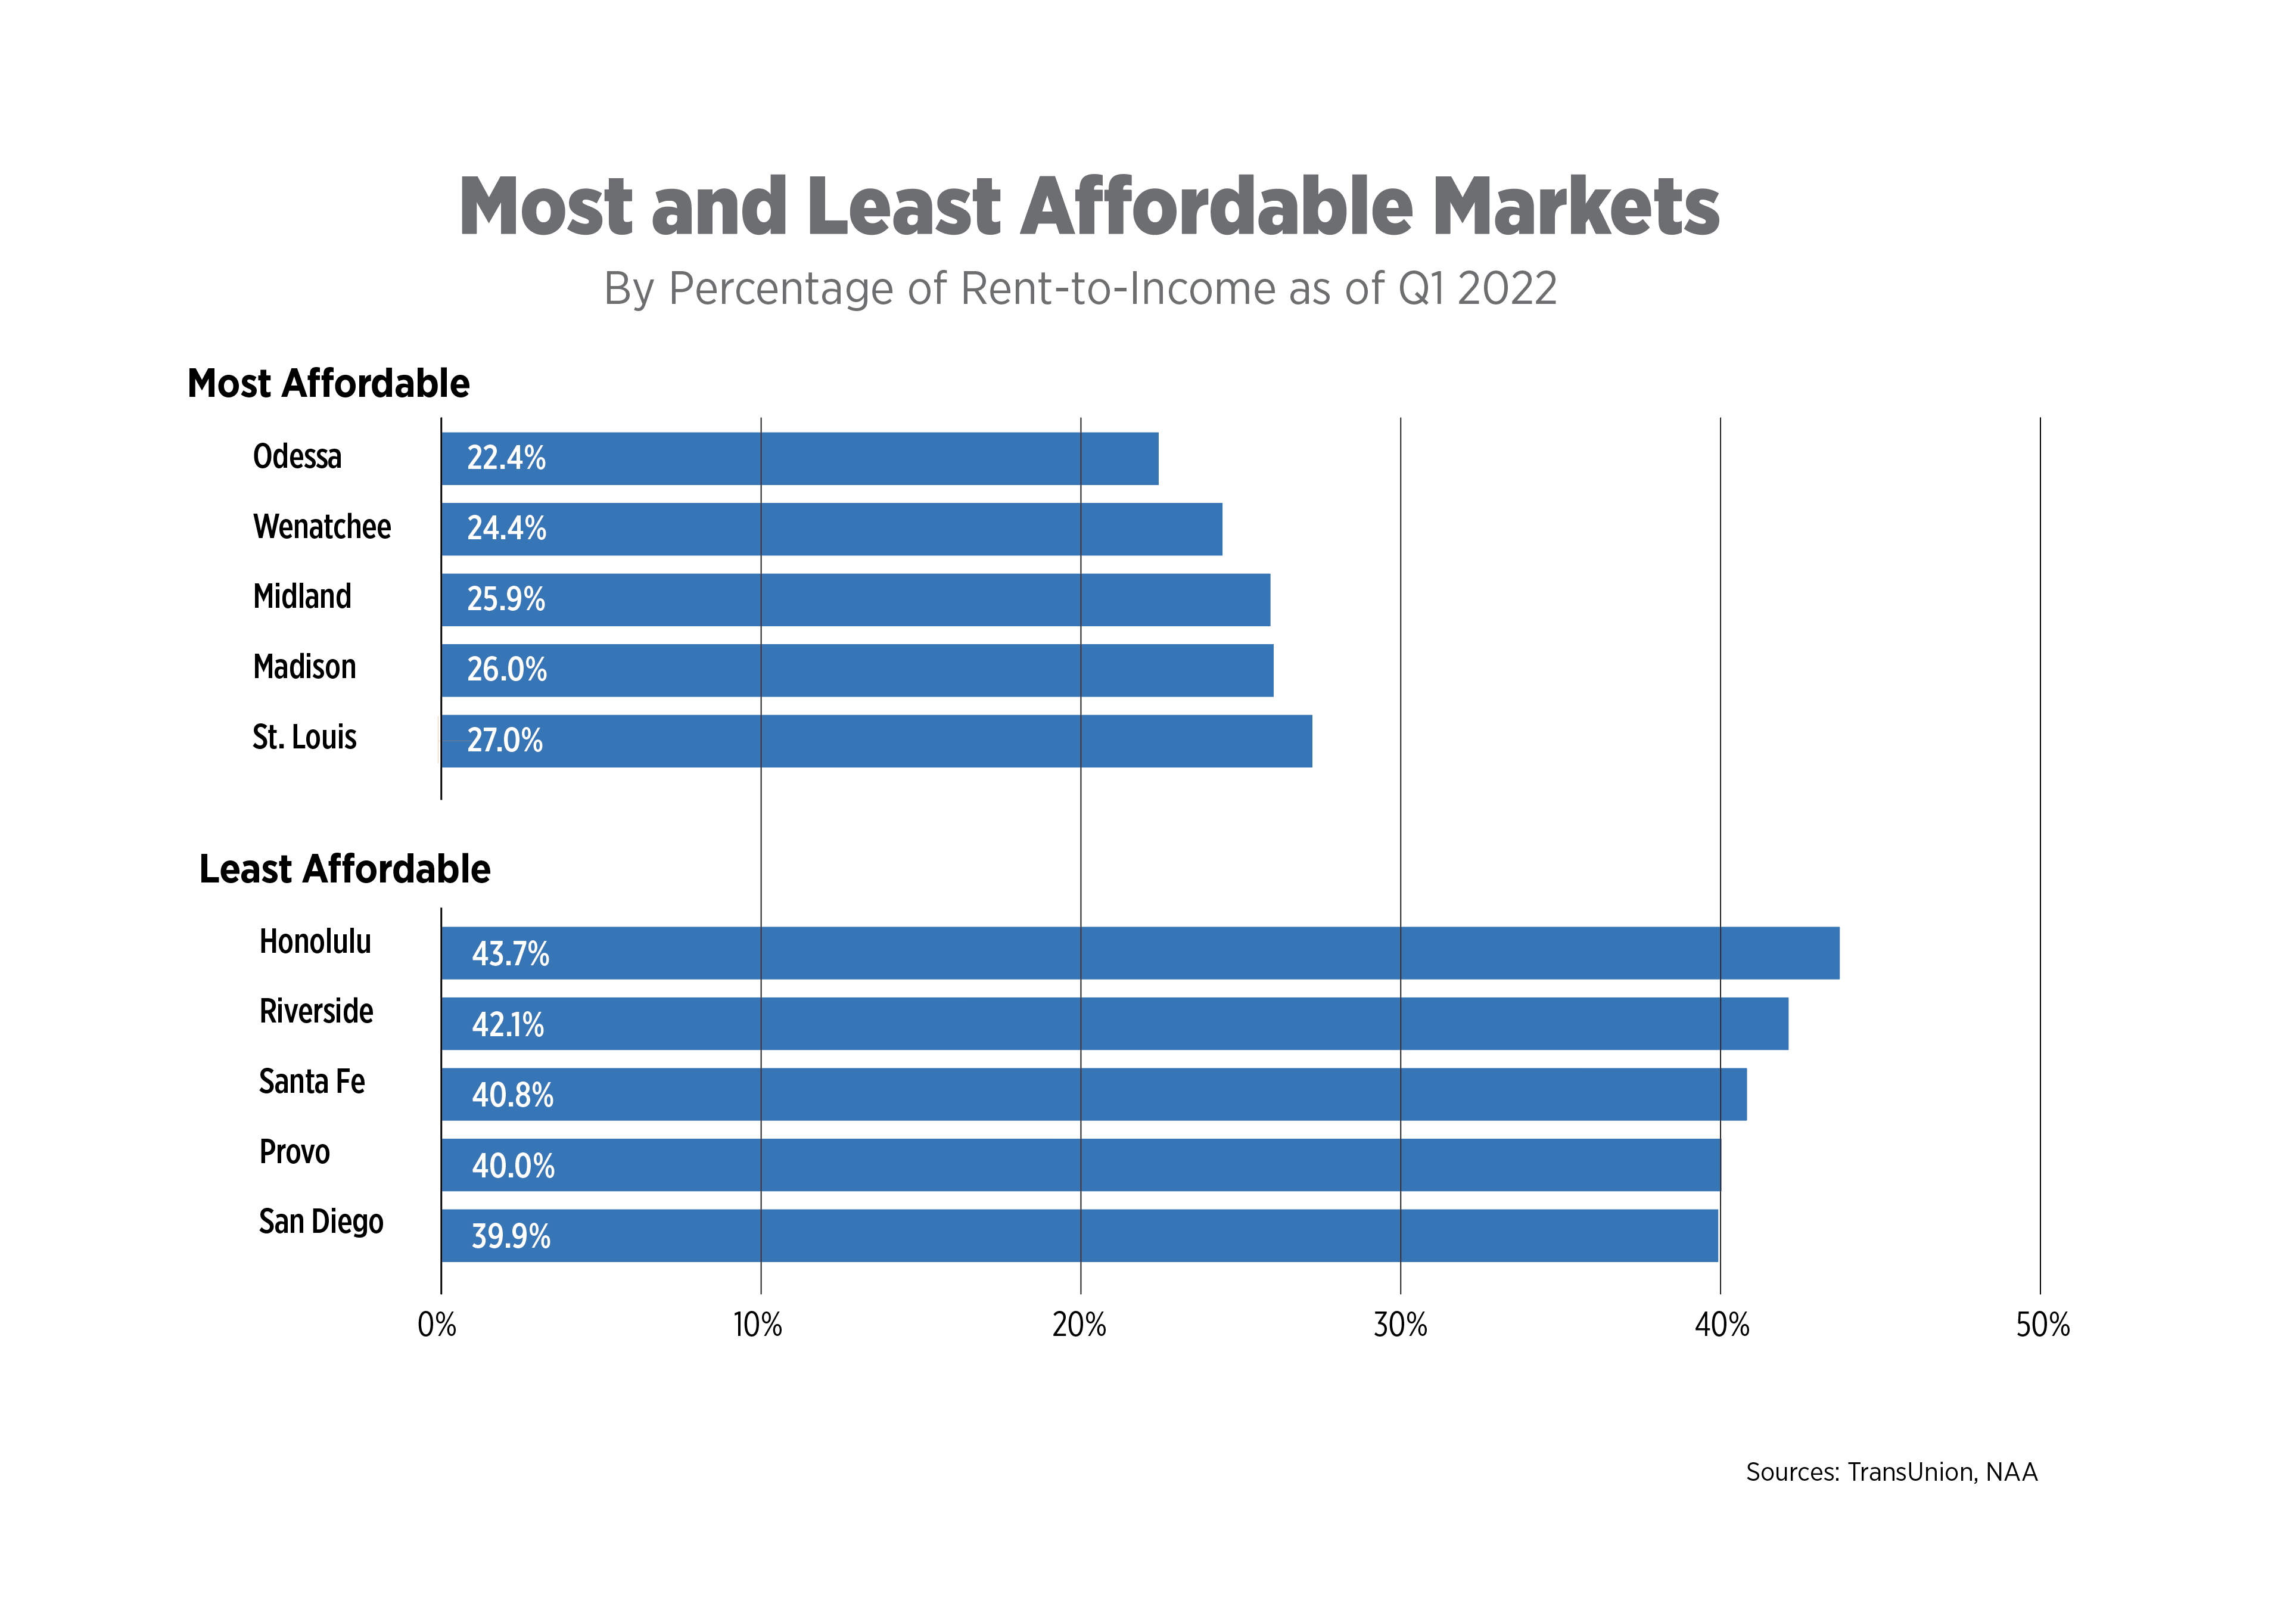
- During the first quarter, renters in Odessa, Texas; Wenatchee, Wash.; Midland, Texas; Madison, Wisc.; and St. Louis spent the lowest percentage of their income on rent. In contrast, renters living in Honolulu, Riverside, Calif., Santa Fe, N.M., and Provo, Utah, spent 40% or more of their income on rent.
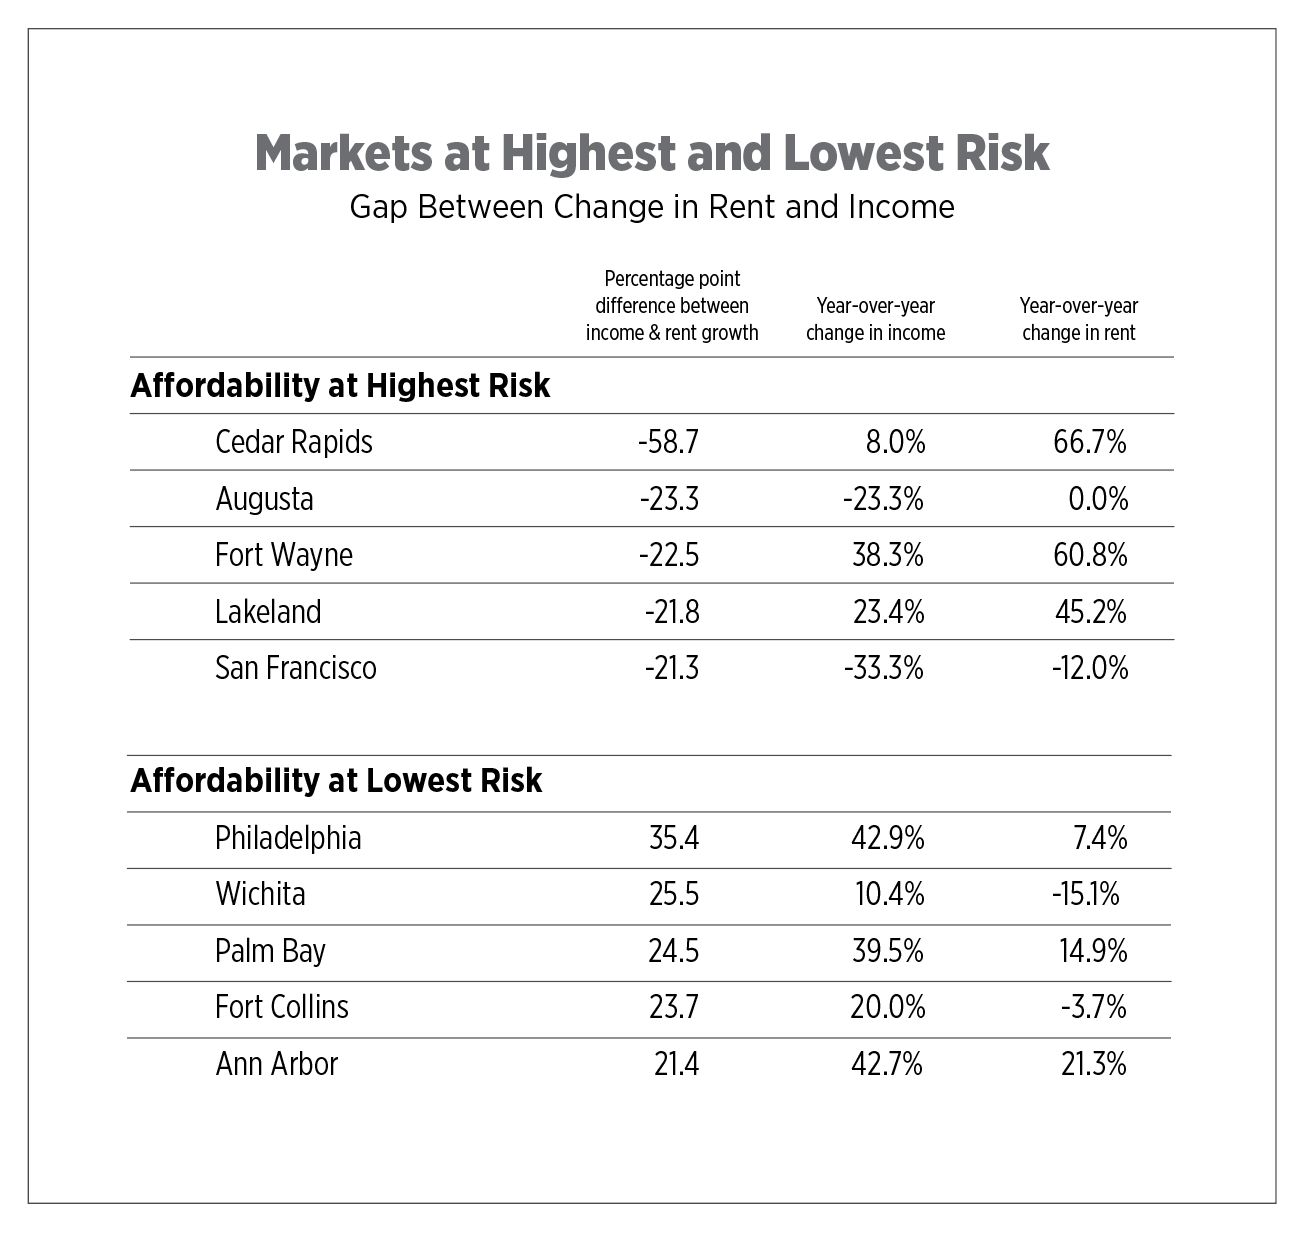
- Due to rent growth surpassing income growth, apartment affordability is at highest risk in Cedar Rapids, Iowa; Augusta, Ga.; Fort Wayne, Ind.; Lakeland, Fla.; and San Francisco. In contrast, income growth exceeded rent growth in Philadelphia, Wichita, Palm Bay, Fort Collins and Ann Arbor, Mich.
How has apartment affordability changed since Q1 2021?
Renters in Philadelphia, Fort Collins, Portland, Wichita and Palm Bay experienced the greatest annual improvement in the percentage of income they spend on rent. Since the onset of the pandemic, high-income renters from surrounding cities have migrated to Philadelphia to take advantage of the affordable rental rates. According to Apartment List, prospective renters from Washington, D.C. and New York City accounted for the most apartment searches in Philadelphia during Q1 2022.
Cincinnati and San Francisco renters felt the pressures of worsening apartment affordability. Effective rent growth in Cincinnati reached nearly 9%, as reported by CoStar. Steady demand and historically high occupancy fueled rent growth. The apartment market in San Francisco has recovered as renters return to coastal markets and tech hubs. Occupancy levels in the Bay Area have rebounded, pushing rents to pre-pandemic prices. At the peak of the pandemic, occupancy dropped to 89.8%. As of Q1 2022, the average occupancy rate stood at 93.4%.
Where are apartments most and least affordable?
Although supply and demand imbalances fueled sharp rent growth, there were still markets where renting remained affordable. Tertiary markets such as Odessa, Wenatchee, Midland, Madison and St. Louis ranked as the most affordable areas in the U.S. The rent-to-income percentages in these markets were below the frequently cited 30% threshold. Apartments in Odessa are still feeling the lingering effects of COVID-19. According to CoStar data, occupancy stood at 85.4% during Q1 2022. Additionally, effective rents are down 23.9% from Q4 2019.
On the other hand, Honolulu, Riverside, Santa Fe, Provo and San Diego were the least affordable markets. Apartment rents surged in Honolulu as vacancies tightened due to renter in-migration from remote workers seeking a beach view. Occupancy hit 97.3% in the first quarter, the highest level since Q4 2000.
The quarterly Affordability Watch tracks rent-to-income percentages for over 100 metropolitan areas. Use the interactive map below to see apartment affordability trends for your local area.
Where is apartment affordability at highest and lowest risk?
Looking at the gap between median rent and income growth, renters in Cedar Rapids, Augusta, Fort Wayne, Lakeland and San Francisco were at the highest risk for affordability concerns as of Q1 2022. Most markets at risk have seen mild income growth accompanied by a much sharper increase in rental prices. In Cedar Rapids, rising home prices and limited stock have pushed more households to renting. As a result, rents are soaring and vacancy rates are historically low.
Renters in Philadelphia, Wichita, Palm Bay, Fort Collins and Ann Arbor were at the lowest risk of being rent burdened. Income growth far outpaced rent increases by more than 20 percentage points in these markets. Demand and occupancy rates in Wichita have muted since Q2 2021, and renters are still benefitting from good deals.
In Conclusion
High demand, limited supply and inflation rates have created pressure on the apartment industry and renter households. Although the pandemic accelerated housing affordability concerns in the U.S., the lack of new supply for all income levels was a major issue before the pandemic. If rents continue to rise faster than income, there is a risk that more households will be rent burdened. Housing affordability issues require responsible and sustainable solutions at the local level that support both renters and housing providers.
Notes:
1. Rent-to-income averages are based on approved residential lease applicants screened by TransUnion’s ResidentScreening platform in Q1 2021 and Q1 2022.
2. Q1 2021 and Q1 2022 data covered 152,831 and 152,314 rental applications, respectively.
3. Market level analysis was conducted for 136 markets which received over 100 applications.
Sources: TransUnion Rental Screening Solutions, NAA Research, CoStar Group, Apartment List